Since working with PIWIK Matomo and the reports itself is very straightforward and well-documented on the PIWIK Matomo website, we restrict ourselves to the most important documentation and specifics for excentos only.
...
| Panel | ||
|---|---|---|
| ||
|
...
Selecting the Date Range
You need to select the date range in order to see the data for a certain day, week, month or time range.
...
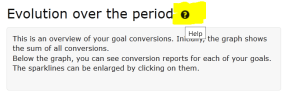
Most reports have help or explanation content. Just hover over the report title and click on the "i"-symbol. Example:
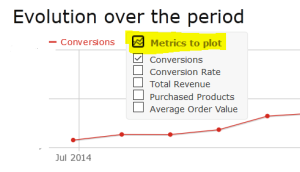
Customize Charts
Most charts allow you to customize the data displayed. Just hover over the metrics to plot - icon to select the attribute
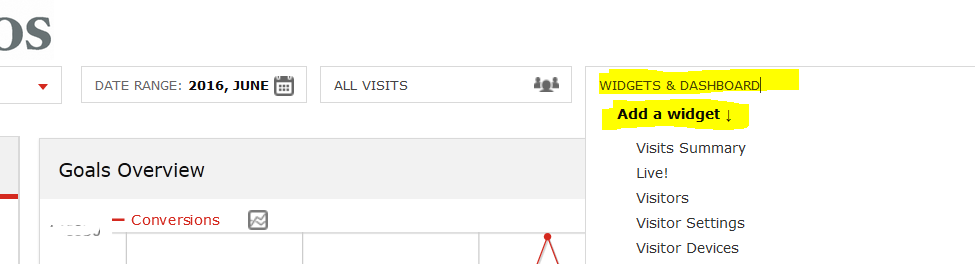
Customize your Dashboard
You can customize your dashboard by adding widgets. To add a widget, click on widgets and dashboards and select add a widget
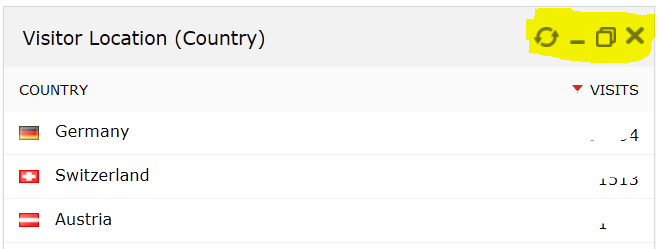
Each widget can also be reloaded, collapsed / expanded or closed to remove it from the dashboard:
Select a Segment
Use the "Segment" selector to filter down to one segment only:
...
Please check regularly, whether the external IP-Addresses of your office and those others in your company have changed. If configured correctly, your own test activities won't have an effect on your statistics as also not the activities of excentos.
Please ask your internal IT department or use a public tool like this to find out your IP address: http://www.heise.de/netze/tools/ip/ and provide excentos with your IP address.