The annotation statistics gives you an overview of the distribution of already annotated products.
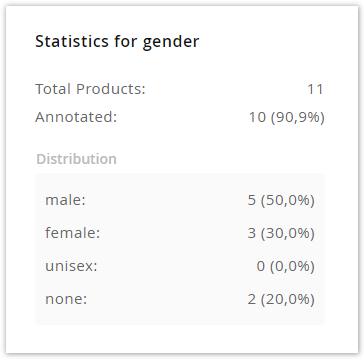
On the top, the total number and the number of annotated products are displayed. The second number and its percentage are especially helpful during annotation, as the prediction model needs a certain amount of products to be able to learn the most likely attribute value of unknown (not annotated) products.
Below, you can also see the distribution of the annotations over the attribute values. It is especially helpful for identifying underrepresented values and consider grouping these together or even removing them, since the model would likely not be able to learn any useful patterns from just a few products.