Pages
Pages (i.e. Pageviews in every of your Product Guides)
Section titled “Pages (i.e. Pageviews in every of your Product Guides)”The report “Pages” in the report section “Behavior” analyzes the number of pageviews per Product Guide. Click on the report section “Actions” and then the report “Pages” to see a table of all Product Guides:
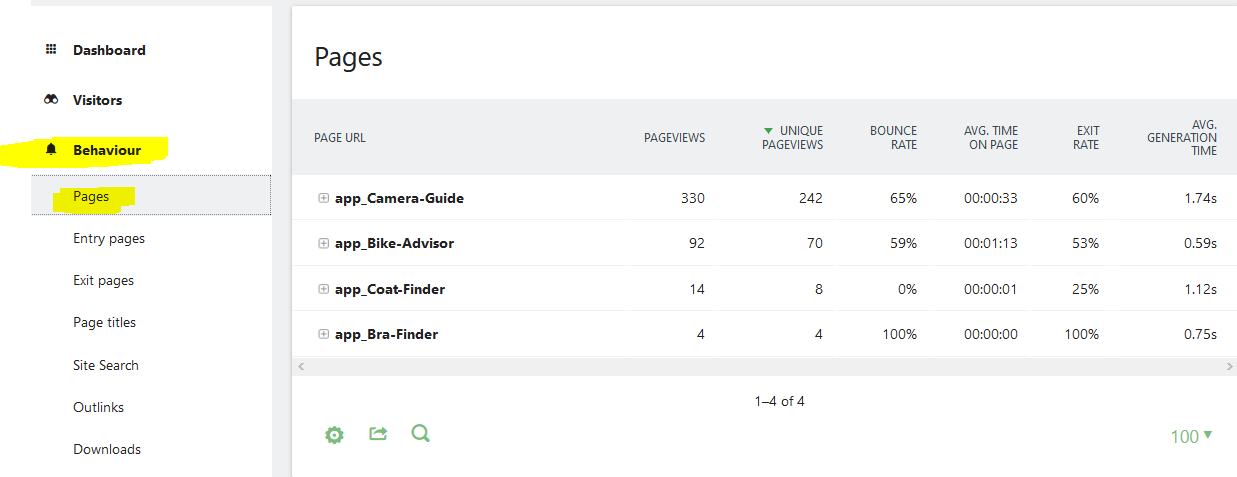
ℹ️ Pageviews in the Matomo analytics framework are used to count every different view or stage of the Product Guide (as if it were a static web page). Most of the times, the Visitor reports are more useful to see how many people actually used your Product Guide in absolute numbers, since the page views report does not show the number of visitors but the number of times pages were displayed.
You can click on the ”+” icon to drill down into each Product Guide and you will see the different Stages of each Product Guide (called “Pages” in Matomo).
ℹ️ Each stage of the Product Guide is called a “Page” or “Page URL” and all Product Guides themselves are called “Pages”. excentos uses the Matomo analytics system which is designed for web pages and the Matomo information model of “Page URLs” is used for stages or views of the Product Guide.
See the Pageviews of one Product Guide only
Section titled “See the Pageviews of one Product Guide only”You can filter down for the traffic of one Product Guide only in 2 ways: Using Segments (see Getting Started with Analytics) or using the Pages report per Product Guide described in this article.
Compare the pageviews in all of your Product Guides for a certain time range
Section titled “Compare the pageviews in all of your Product Guides for a certain time range”If you want to compare the pageviews in all of your Product Guides for a certain time range back into the past, the analytics unfortunately does not offer a report out-of-the-box. However, you can create this report yourselves:
-
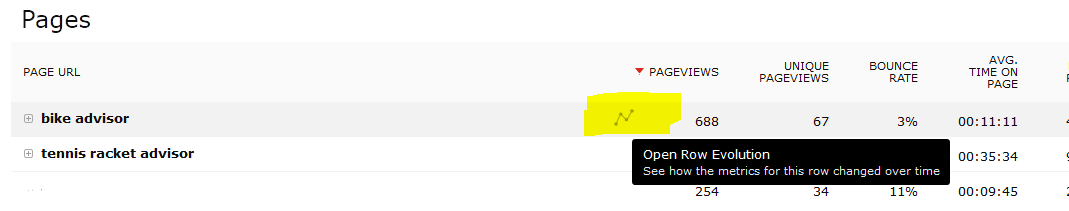
in the “Pages” report, hover over one of the Product Guides and you will see a chart symbol “open row evolution”. This report opens a chart of this Product Guide back into the past
-
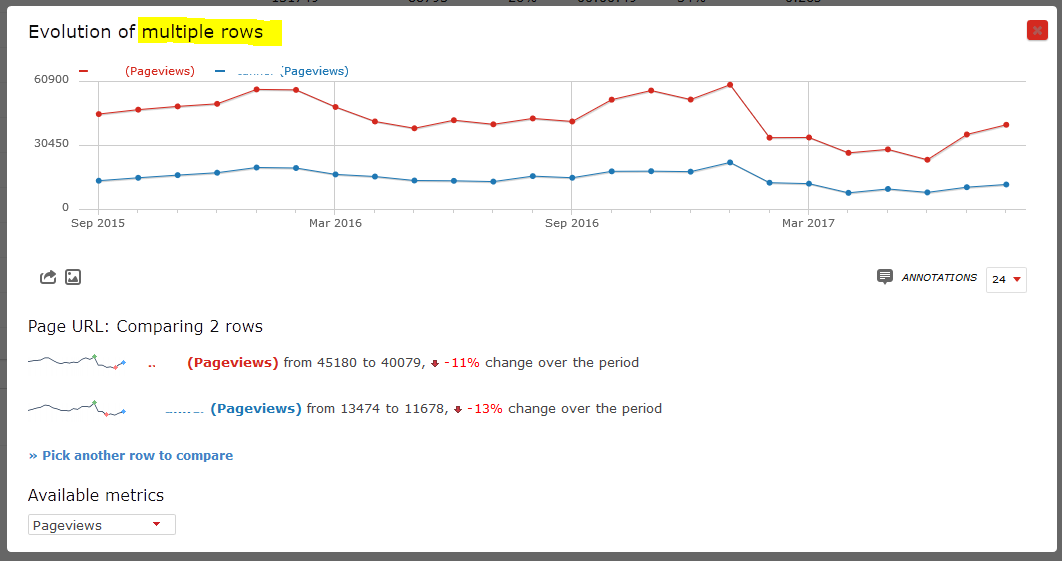
at the bottom of the overly, select “Pick a row to compare” in the “Compare records” section. The overlay closes and you can select the second timeline with “open row evolution”. Once you have selected a second Page (i.e. Product Guide), the overlay opens again and you will see two lines in the chart: