This page tree shows how to work with the reports of the web analytics system. The documentation also contains FAQ on certain reports.
The documentation will be completed upon request / - so please contact excentos if you're missing documentation on a report. Otherwise, please refer to the general Matomo description linked in Getting Started with Analytics.
Overview
Every report is documented in a separate page:
Introduction how to work with reports
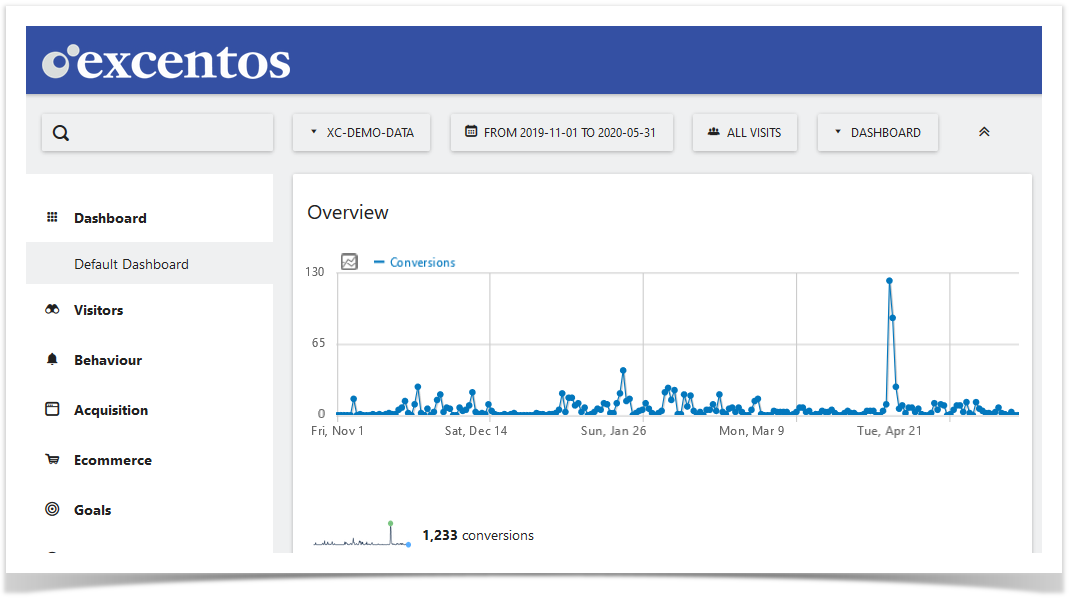
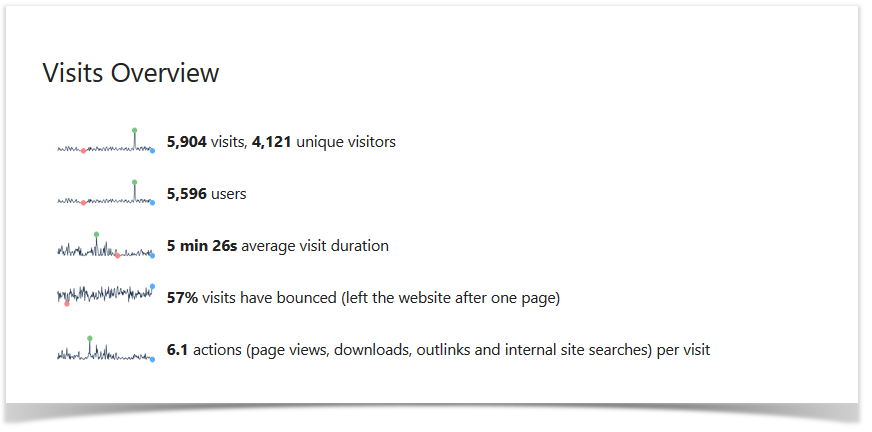
If you enter the analytics, the Dashboard view is presented with a summary of most important figures and charts:
This documentation uses the report sections and report names as defined in the excentos Analytics (see left navigation bar in the analytics):
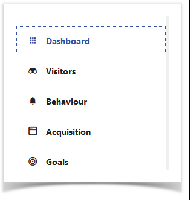
If you click on one of the report sections (e.g. "Visitors"), the navigation bar expands and shows the reports available in this section.