The report section Actions allows you to analyze the actions that your visitors performed in the Product Guide, such as clicking on answers / selection options and navigation within the Product Guide.
Pages (i.e. Pageviews in every of your Product Guides)
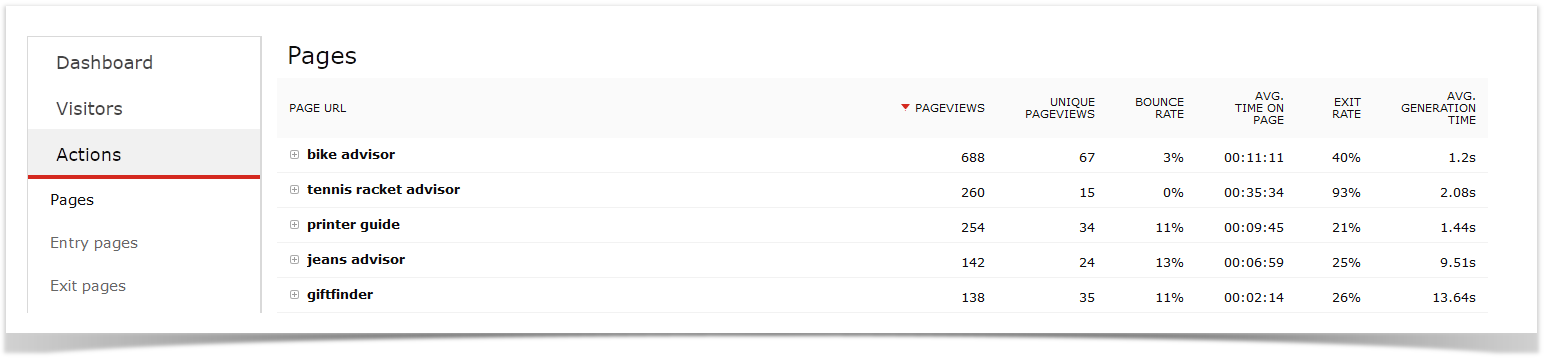
The report "Pages" in the report section "Actions" analyzes the number of pageviews per Product Guide. Click on the report section "Actions" and then the report "Pages" to see a table of all Product Guides:
![]() Pageviews in the Matomo analytics framework are used to count every different view or stage of the Product Guide (as if it were a static web page). Most of the times, the Visitor reports are more useful to see how many people actually used your Product Guide in absolute numbers, since the page views report does not show the number of visitors but the number of times pages were displayed.
Pageviews in the Matomo analytics framework are used to count every different view or stage of the Product Guide (as if it were a static web page). Most of the times, the Visitor reports are more useful to see how many people actually used your Product Guide in absolute numbers, since the page views report does not show the number of visitors but the number of times pages were displayed.
You can click on the "+" icon to drill down into each Product Guide and you will see the different Stages of each Product Guide (called "Pages" in Matomo).
![]() Each stage of the Product Guide is called a "Page" or "Page URL" and all Product Guides themselves are called "Pages". This is because the Matomo analytics system that excentos uses is designed for web pages and we used the Matomo information model of "Page URLs" for stages or views of the Product Guide.
Each stage of the Product Guide is called a "Page" or "Page URL" and all Product Guides themselves are called "Pages". This is because the Matomo analytics system that excentos uses is designed for web pages and we used the Matomo information model of "Page URLs" for stages or views of the Product Guide.
See the Pageviews of one Product Guide only
You can filter down for the traffic of one Product Guide only in 2 ways: Using Segments (see Getting Started with Analytics) or using the Pages report per Product Guide described in this article.
Compare the pageviews in all of your Product Guides for a certain time range
If you want to compare the pageviews in all of your Product Guides for a certain time range back into the past, the analytics unfortunately does not offer a report out-of-the-box. However, you can create this report yourselves:
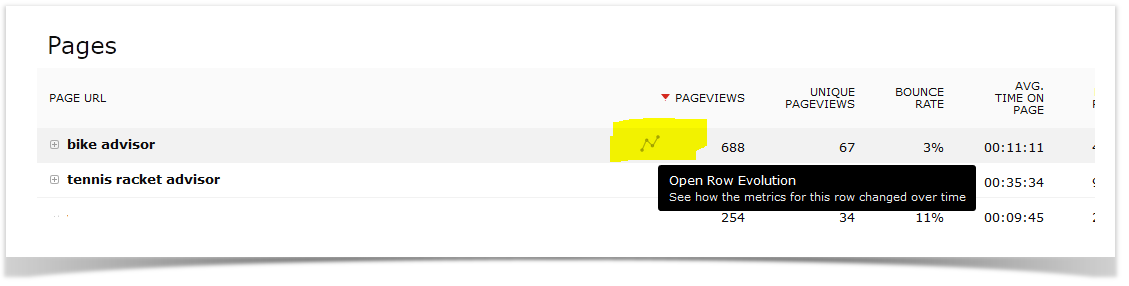
- in the "Pages" report, hover over one of the Product Guides and you will see a chart symbol "open row evolution". This report opens a chart of this Product Guide back into the past
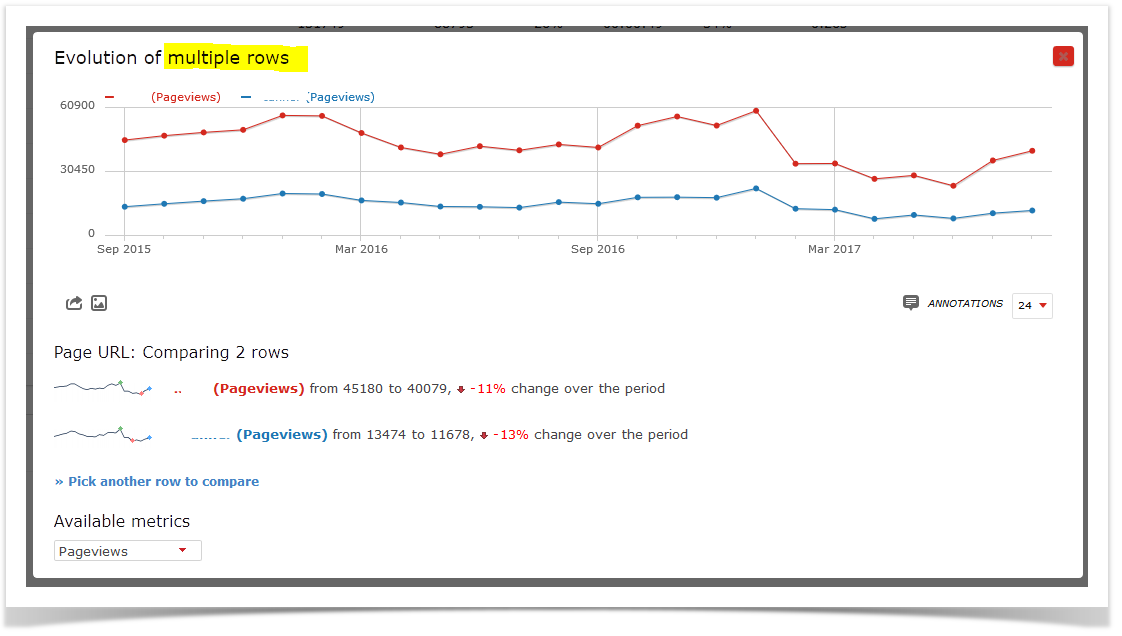
- at the bottom of the overly, select "Pick a row to compare" in the "Compare records" section. The overlay closes and you can select the second timeline with "open row evolution". Once you have selected a second Page (i.e. Product Guide), the overlay opens again and you will see two lines in the chart:
Navigation Events
Check the report "Actions | Page Titles" to analyze how your users navigated through your Product Guides, i.e. how he used the phase navigation and the previous / next buttons..
| Question | Answer |
|---|---|
| what does the event questionGroup | next or | previous mean? | the "next" event is the e.g. "forward / next question" button of the Product Guide. The drill-down shows which phases showed up once the user selected the "next" button (and corresponding for "previous / back") |
| what does the event questionGroup | to mean? | the "to" event is a direct click on the phase navigation |
| what does the event browserHistory | to mean? | the browserHistory-Event is tracked if the user used the native browser back or forward button. The drill-down shows to which phase the browser back action navigated to. |
| what does the event comparison | showComparisonTable mean? | shows the number of clicks which opened the comparison view |
| what does the event productlist mean? | depending on the navigation options / pager / auto-scroll in your result list, there may be an event "productlist | page_forward". The event depicts how users navigated in the result list of the Product Guide |
Exit Pages
The Report Actions | Exit pages allows you to analyze at what stages of the Product Guide the users exited the Product Guide.
![]() Please read the definition on "what is an Exit?" to understand that - depending on the action - a certain Exit rate is normal and desired and does not necessarily mean that your Product Guide does not work successfully, since we want users to perform other actions in your shop or website after interacting with the Product Guide.
Please read the definition on "what is an Exit?" to understand that - depending on the action - a certain Exit rate is normal and desired and does not necessarily mean that your Product Guide does not work successfully, since we want users to perform other actions in your shop or website after interacting with the Product Guide.
If you hover over the report title or column titel, you will see tool tips with definitions of each figure in the report.
Definition of an Exit
An Exit was reached if a visitor ceases to do further actions on the Product Guide during the lifetime of the session. It is an implicit information because Exit is tracked once the Analytics cannot observe any further event within the session upon completion of the session. The session lifetime can be configured per project; we typically use 10 to 15 minutes.
The events before the Analytics tracks an Exit can be:
- preceded by a positive exit action such as clicking the link to product detail page, link to shopping cart, link to dealer search. In this case, this positive action was the last event that the Analytics could track within the session. It does not necessarily mean that the user left the Product Guide - only the Analytics did not track any events any longer within the session
- preceded by a negative exit action (aka "dropouts") such as the user closing the browser window or leaving the website
![]() Thus, be careful when analyzing the Exit figures since they show both Exits that were intentional / positive and Exits where the user no longer wanted to use the tool. See the example below for what can and what cannot be deduced from the Exit figures.
Thus, be careful when analyzing the Exit figures since they show both Exits that were intentional / positive and Exits where the user no longer wanted to use the tool. See the example below for what can and what cannot be deduced from the Exit figures.
![]() Please note that an Exit is not tracked in the Recommentation stage if the user clicked on further facets to refine the result list, since Matomo interprets this as site search events and thus does not consider the search being ended.
Please note that an Exit is not tracked in the Recommentation stage if the user clicked on further facets to refine the result list, since Matomo interprets this as site search events and thus does not consider the search being ended.
At what point / after which action do your users exit the Product Guide?
Check the report Actions | Exit Pages.
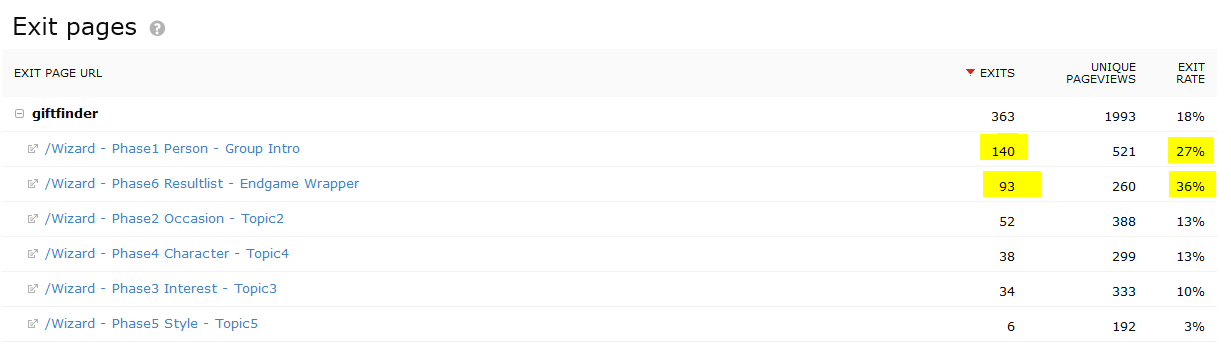
See this example report:
What can be and what cannot be deduced from this report
What you can deduce from this report:
- 140 times, a visitor that entered the "Phase 1 Person", performed no other action after this view was displayed to him
- since the view "Phase 1 Person" was displayed 521 times, this accounts to an exit rate of 140 / 521 = 27%.
- interpretation: in some situations (and also depending on which information was displayed to the user before he entered it), some users expected something else (e.g. online chat, phone or video advisor session) and thus leave the Product Guide.
What you cannot deduce from this report:
- you cannot deduce from this report that only 36% of the users clicked on a link to a Product Detail Page, since:
- 93 times, a visitor performed no other action that is measurable for excentos after visiting the "Phase 6 Resultlist".
- if you want to find out how many users clicked on outlinks to e.g. your Product Detail Pages, see the report Goals and then e.g. "Success (Exit to Products)"
![]() Benchmark: We experienced that 25 - 35% exit rate in the first phase of a wizard-style Product Guide are normal. Compare this to other landing pages in your website. If your exit rate on the entry page is much higher than this rate, possible actions are:
Benchmark: We experienced that 25 - 35% exit rate in the first phase of a wizard-style Product Guide are normal. Compare this to other landing pages in your website. If your exit rate on the entry page is much higher than this rate, possible actions are:
- create better content for the entry page
- check if the links and landing pages before linking into the Product Guide promise the same thing as what the Product Guide offers - otherwise, users start the Product Guide with wrong expectations and leave it after the first impression
If you want to exclude positive exits from the Exit report in order to focus on the negative Exits only, try adding a segment "Visit converted a specific Goal ID" with goal 3 and 4 (in the standard goal configuration, see goals below).