This page describes the reports in the report section "Visitors". These reports analyze the number and behavior of the visitors of your Product Guide.
Definitions: Visit and Visitor
![]() A Visit (also known as a Session) is defined as an interaction of one individual with the Product Guide with one or more requests to the Product Guide.
A Visit (also known as a Session) is defined as an interaction of one individual with the Product Guide with one or more requests to the Product Guide.
During the course of a Visit, the user can leave the Product Guide and come back, and if the user does so within the session timeout, it is not counted as a new Visit. Examples of leaving the Product Guide and coming back are: Navigating from the Product Guide to the website's product detail pages or any other content in the website where the Product Guide is integrated; closing the browser and reopening the browser again and re-visiting the website / Product Guide afterwards.
The default session timeout is set to 15 minutes.
Please note that re-establishing a Visit after the user closed his browser is only possible if the session cookie was not deleted.
![]() A (Unique) Visitor is a specific user that interacted with the Product Guide.
A (Unique) Visitor is a specific user that interacted with the Product Guide.
In most cases, you will realize less Unique Visitors than Visits since a Visitor may visit the website or Product Guide several times.
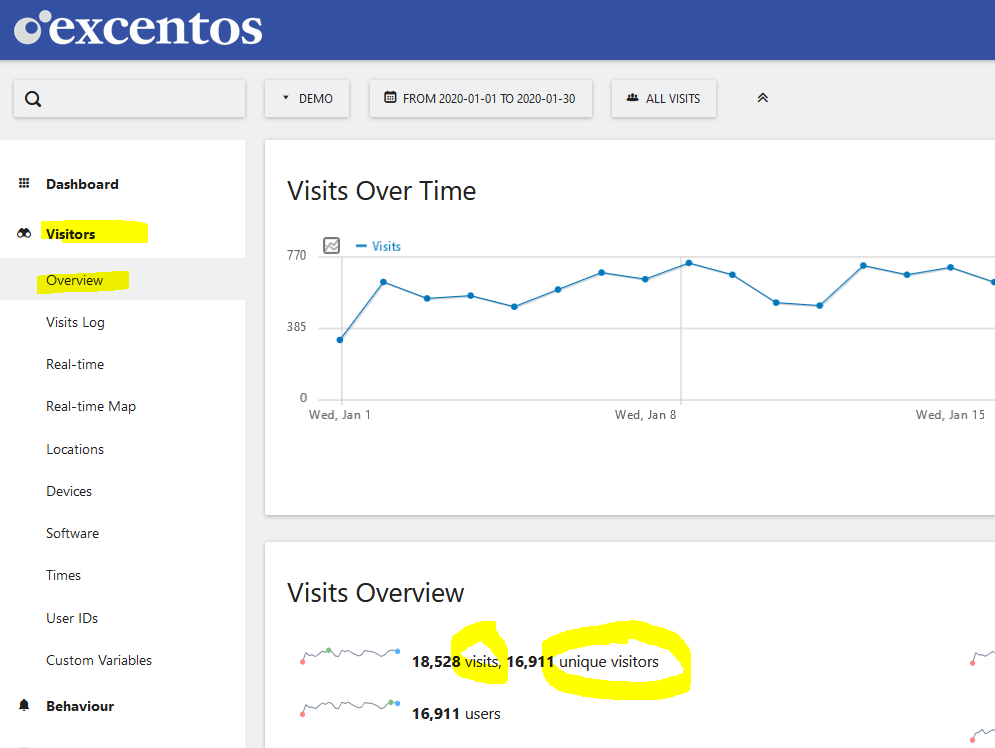
See the number of Visitors and Visits
To see the overall traffic in your Product Guides, the easiest report is to check the Visitors Overview:
See the number of Visitors for one Product Guide
To analyze the number of visitors in one Product Guide, click on the report section "Visitors" and then select the "Custom Variables" report. The first variable is "Application" and you can then click on the "+" icon to see all Product Guide applications in one report:
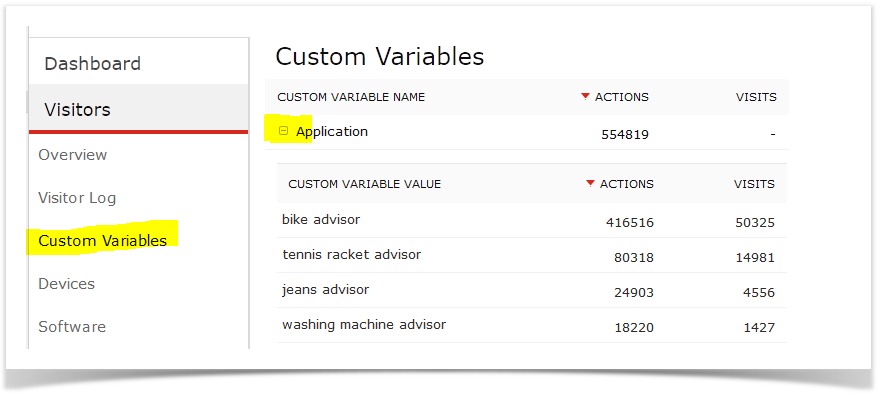
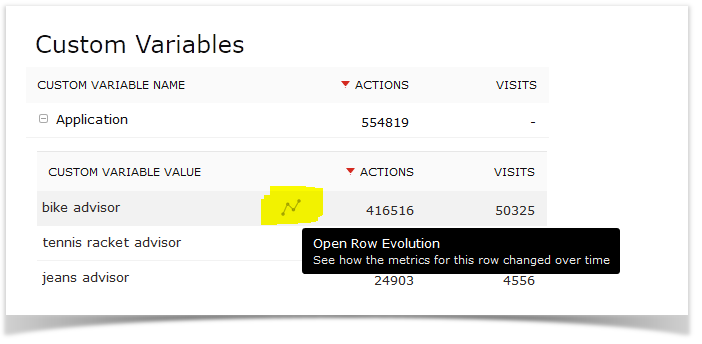
Chart with Timeline for Number of Visits
If you want to see a row evolution to analyze the Product Guide visits over time, click on the "Open Row Evolution" button that is shown on hover:
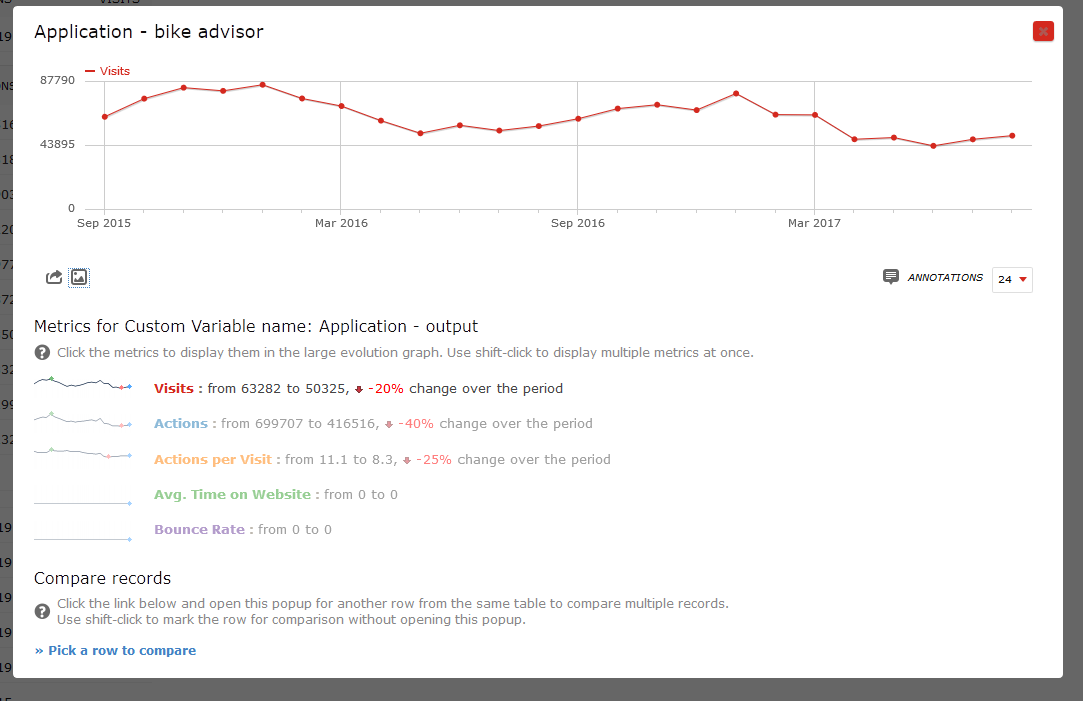
This opens a chart showing the timeline for a certain Product Guide:
Compare the visits of your Product Guides for a certain time range
If you want to compare the visits of your Product Guides for a certain time range back into the past, the analytics unfortunately does not offer a report out-of-the-box. However, you can create this report yourselves:
- in the "Custom Variables" report, hover over one of the Product Guides and you will see the chart symbol "open row evolution" as described above. This report opens a chart of this Product Guide back into the past (see example above)
- at the bottom of the overlay, select "Pick a row to compare" in the "Compare records" section. The overlay closes and you can select the second timeline with "open row evolution". Once you have selected a second Application (i.e. Product Guide), the overlay opens again and you will see two lines in the chart:
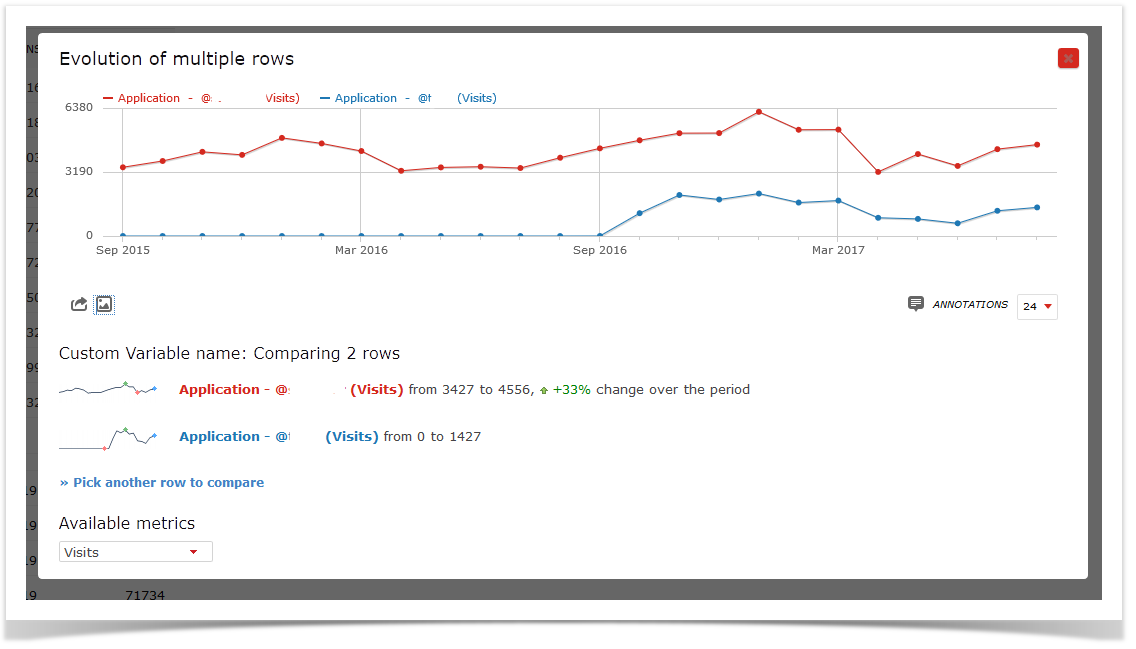
- you can then add as many rows as you like to your comparison