
Getting Started with Analytics
Introduction / Get started
Section titled “Introduction / Get started”excentos recommends the following steps to get you started with the Analytics:
- change your password (click on the username on the top right, select Personal | Settings in the menu and scroll down to the change password dialog
- please make sure your selected user language is english since the entire documentation and naming of success goals is in english (this is also edited in Personal | Settings)
- browse through the Dashboard and the other main reports to get familiar
Selecting the Date Range
Section titled “Selecting the Date Range”You need to select the date range in order to see the data for a certain day, week, month or time range.
Click on the “Date range” box; select a period (e.g. month, week, day) and then click into the calendar to confirm the date range (you also need to click into the calendar if you select an entire month to confirm your selection).
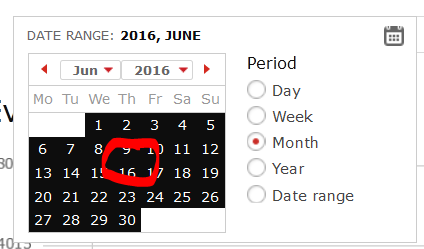
ℹ️ If you select “day” or “date range”, the x-axis (showing the timeline) will be based on days. This may cause slower performance of your reports since every data is calculated on a daily instead e.g. monthly basis. To perform the reports on a monthly basis, select the period “month”.
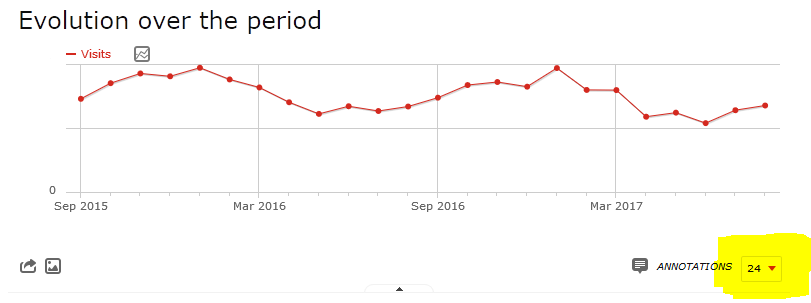
If you selected “month” or “week” or “year”, the charts are displayed with a certain time range back into the past (note: this only applies to the charts; the table reports show only the currently selected date range). You can change the time range displayed in the charts by selecting the dropdown on the lower right of the corresponding chart:
Help and Explanations / Tooltips
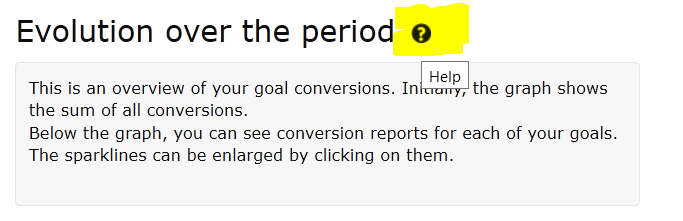
Section titled “Help and Explanations / Tooltips”Most reports have help or explanation content. Just hover over the report title and click on the “i”-symbol. Example:
Customize Charts
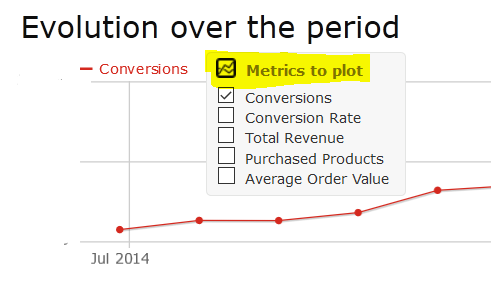
Section titled “Customize Charts”Most charts allow you to customize the data displayed. Just hover over the metrics to plot icon to select the attribute
Customize your Dashboard
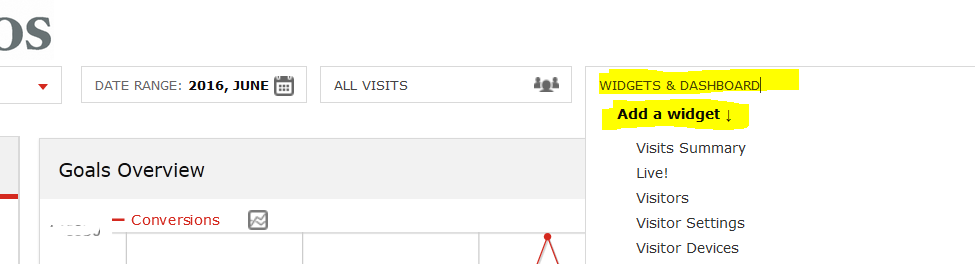
Section titled “Customize your Dashboard”You can customize your dashboard by adding widgets. To add a widget, click on widgets and dashboards and select add a widget
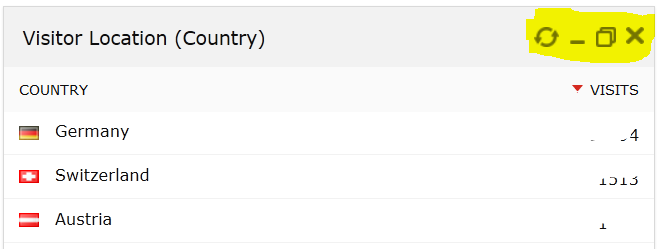
Each widget can also be reloaded, collapsed / expanded or closed to remove it from the dashboard:
Select a Segment
Section titled “Select a Segment”Use the “Segment” selector to filter down to one segment only:
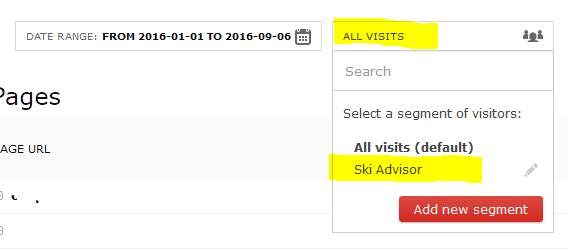
If the segments you need don’t exist yet, please contact excentos or use the Pages report.
Activate Commerce Tracking
Section titled “Activate Commerce Tracking”excentos provides powerful and easy-to-integrate features to track real shopping cart transactions (see more). Activating commerce tracking means that excentos gets access to your shopping cart data for completed transactions of visitors that used the Product Guide. excentos needs this information to fully understand the buying process and exit points, and increase conversion, margins and generate new customers far better if commerce tracking is enabled.
excentos only gets information on visitors that actually used the Product Guide, thus information of other users of your shop or website stays confidential.
Please contact excentos to activate commerce tracking.
IP Address Filtering
Section titled “IP Address Filtering”The excentos Web Analytics filters internal IP addresses (such as excentos-offices, your offices) as internal traffic. The data is logged into log files, but not processed for the reports.
Please check regularly, whether the external IP-Addresses of your office
and those others in your company have changed. If configured correctly,
your own test activities won’t have an effect on your statistics as also
not the activities of excentos.
Please ask your internal IT department or use a public tool like this to
find out your IP address: http://www.heise.de/netze/tools/ip/ and
provide excentos with your IP address.